Is the midlife crisis a common rite of passage—or just a mythical concept that makes for grabby headlines? Research measuring well-being has typically provided solid evidence for such a period of soul searching. Over the course of a lifetime, happiness tends to start out high early in adulthood and decline in middle age, only to rise later in life. Unhappiness follows a mirror pattern—with the youngest and oldest tending to be the least unhappy and those in middle age being the most unhappy.
Plotting both qualities against age, the happiness curve is U-shaped (with the left and right peaks of the “U” corresponding to youth and old age), and the graph for unhappiness is depicted as a hump shape. Reduced to simpler terms, the midlife crisis seems to be real: happiness reaches its low point at around age 50,with peaks at age 30 and after age 70. This finding has been replicated in 146 countries and has held true for data reaching as far back as 1973—and does not just apply to Homo sapiens. Researchers have even identified similar patterns in nonhuman apes.
“It’s an established fact. We called it one of the most striking, persistent patterns in social science,” says David Blanchflower, a professor of economics at Dartmouth College, who co-authored one of the first papers on the U-shaped curve of happiness in 2008.
On supporting science journalism
If you’re enjoying this article, consider supporting our award-winning journalism by subscribing. By purchasing a subscription you are helping to ensure the future of impactful stories about the discoveries and ideas shaping our world today.
The curve was persistent for decades, he says, “until it wasn’t.” Blanchflower and his colleagues have recently released a National Bureau of Economic Research (NBER) working paper suggesting that this hump-shaped pattern in unhappiness has been replaced with a graph line that reveals a consistent decrease in unhappiness with age. This pattern is driven by an increase in unhappiness among young people both in absolute terms and relative to older people. In a follow-on blog post, Blanchflower has shown there has been a corresponding decrease in happiness in this group, leading to a similar change in the U-shaped pattern in happiness by age: now the line on the graph shows a consistently increasing line.

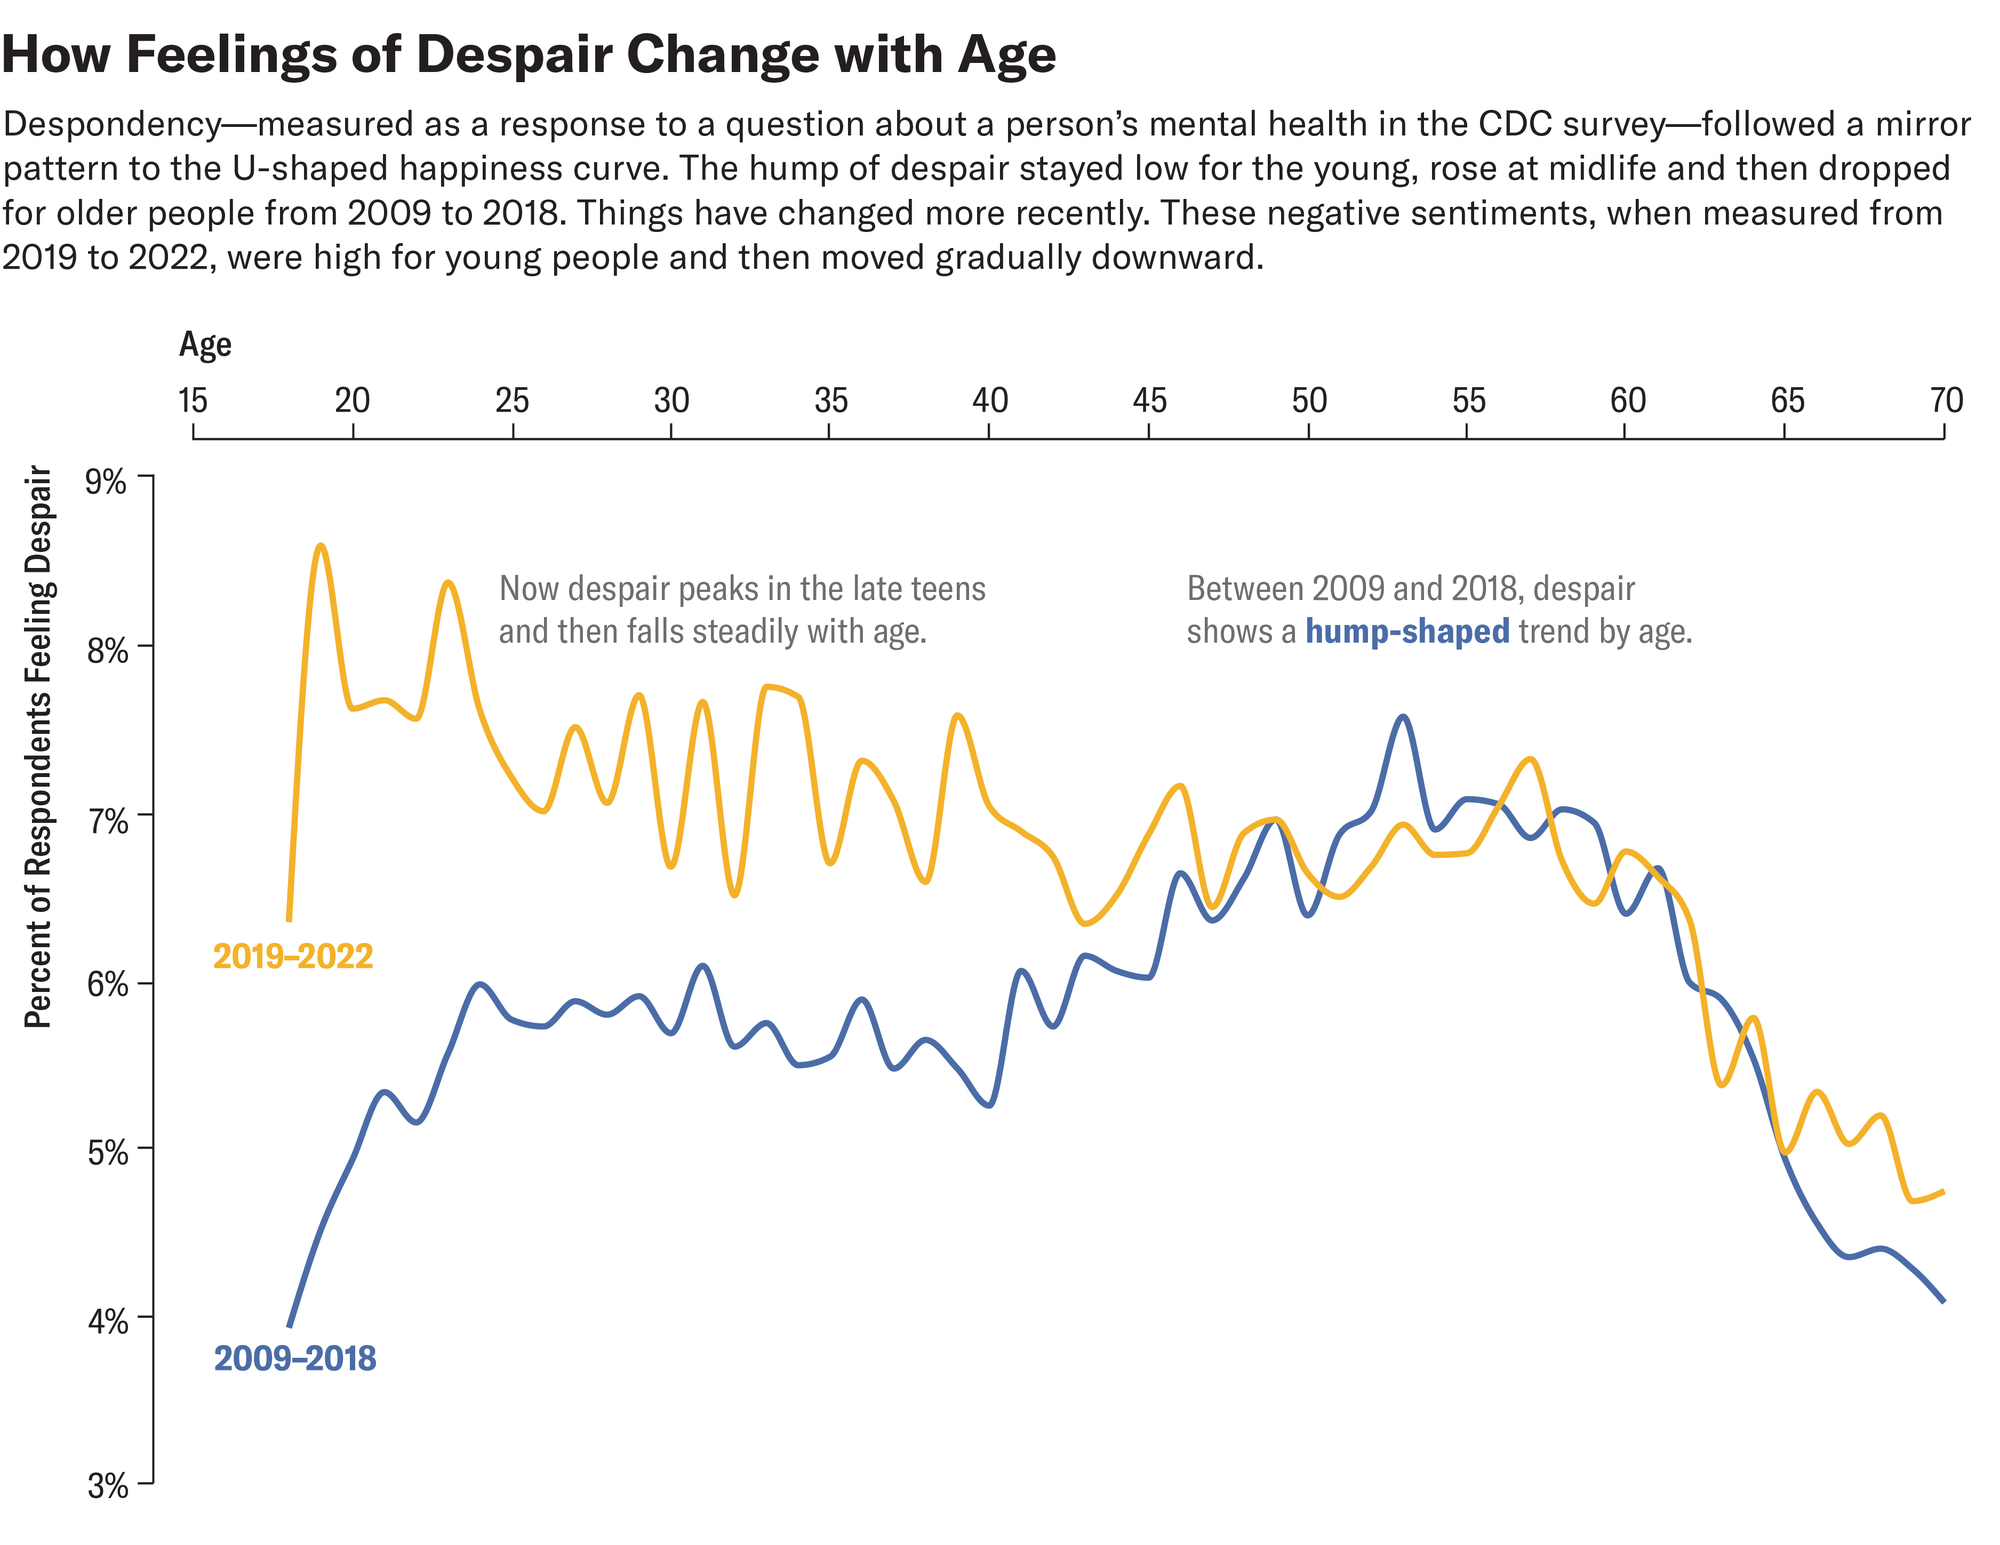
The study on the longitudinal changes in unhappiness analyzes data from the Centers for Disease Control and Prevention–administered Behavioral Risk Factor Surveillance System from 2009 to 2022. In particular, the authors tracked those who answered “30” to the question: “Now thinking about your mental health, which includes stress, depression, and problems with emotions, for how many days during the past 30 days was your mental health not good?”
“We have to focus on the people at the extremes,” Blanchflower says. “Think about those who are most susceptible to commit suicide, to have deaths of despair. These are the people who say, ‘Every day of my life is a bad mental health day.’” Between 2020 and 2022, more than half of respondents reported no bad mental health days. But 7 percent acknowledged exactly 30. The proportion of those with this response nearly doubled from 1993 to 2023. That rate has grown most quickly among the young, especially women 18 to 25 years old. “This fact alone is the most striking and scary: my estimates are that 11 percent of … young women are in despair,” Blanchflower says.
Carol Graham, a senior fellow at the Brookings Institution whose work focuses on well-being, acknowledges the seriousness of this finding. “We never really thought about the lowest point being in youth,” she says. “That is when people are just starting their lives. It shouldn’t be when they are most anxious, are most depressed and have no hope for the future. There is something profoundly wrong there.”
These trends have resulted in an altered relationship between age and ill-being. Between 2009 and 2018, despair remained hump-shaped, jibing with the preexisting research. A rapid rise in despair before age 45, especially before age 25, however, means that in 2019 unhappiness showed up more frequently at younger ages. “Danny Blanchflower has been hell-bent on showing the U-curve in so many countries…, and all of a sudden he’s writing a paper that’s showing the opposite,” Graham says.
“The question is,” Blanchflower says, “why didn’t I see this?” At first, he focused on deaths of despair among a narrow population: middle-aged white individuals without a college degree. Later, as he put it, he “thought that everything was COVID.” Now, Blanchflower says, he sees that was an error. “COVID extended trends that had existed before,” he says.
In their NBER paper, he and his co-authors replicated these findings using data from the U.K. and found evidence suggesting similar patterns in Australia, Canada and New Zealand. Based on a dataset covering 34 countries from 2020 to 2023 from Sapien Labs’ Global Mind Project, the authors showed that ill-being is currently at higher levels at younger ages—and the trend is not a hump shape—across these countries. “We thought it was the U.S., but … we’re seeing it everywhere, and that’s why we’re panicking,” Blanchflower says.
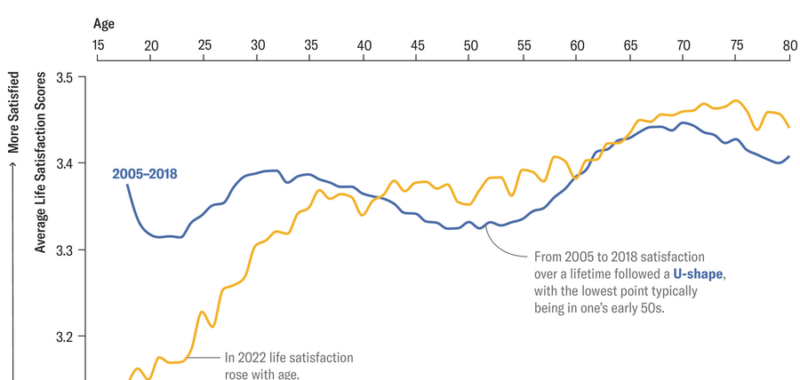
In the follow-on blog post, he and one of his co-authors also investigated trends in happiness to test whether the U-shape curve in well-being has correspondingly shifted. Plotting data collected from 2005 to 2018 and in 2022, the researchers demonstrated that during the first years of the survey, the traditional U-shape persisted, while in 2022 the data showed a constantly rising curve, with young people at the lowest point at its left and the graph line steadily trending upward with age. “I think we should be pretty shocked,” Graham says about the results. “The U-curve is not only an intuitive finding, but it’s also been very consistent across most countries in the world.”
In their NBER working paper, he and his co-authors focused on unhappiness and excluded happiness data because they were investigating negative life outcomes. Poor mental health is correlated with school absenteeism, psychiatric hospital admissions and suicide rates. “Medically, unhappiness is simpler,” Blanchflower says. “If you go back to [previous research], people who [were] significantly unhappy were the people who committed to suicide, had drug overdose deaths or died from alcohol poisoning. We’re looking at things that give us indicators of bad stuff that might come.”
There is no definitive consensus on the driver of the decline in happiness and rise in unhappiness among young adults, though Blanchflower believes the trend is driven by cell phone and social media usage. “What you need here is something that starts around 2014 or so, is global and disproportionately impacts the young—especially young women,” he says. “Anybody that comes up with an explanation has got to have something that fits that. Other than cell phones, I don’t have anything.”
Regardless of the cause, however, “this is a global problem,” Blanchflower says. “We’re past the point of measuring. We should be out doing pilots, trying to figure out what might work. We should be trying to come up with solutions…. Tell me what we can do to help these young people who are in trouble.”
IF YOU NEED HELP
If you or someone you know is struggling or having thoughts of suicide, help is available. Call or text the 988 Suicide & Crisis Lifeline at 988 or use the online Lifeline Chat.